Overview of Logs, Runs & Data Errors
With our latest release of MyRapidi, we have done some changes to the Logs page.
What's new?
First of all, we have changed the navigation. Now we have 'Logs' in the main menu and created some additional sub-pages under the 'Logs' page. We have moved the 'Runs' page to be the first sub-page under 'Logs'. Before you had the 'Runs' menu item in the main navigation. The second sub-page under 'Logs' will be the Logs page, which before was situated as a separate menu item in the main navigation. Last but not least, the third sub-page under 'Logs' is a new sub-page called 'Data Errors'.
Why did we make this change?
As mentioned, before you had both 'Runs' and 'Logs' in the main navigation. Seen from a design perspective it took up a lot of space just to have one kind of list or view for one page. Also, we have been receiving feedback from both customers and implementation consultants, that it would be good to have multiple views and also to find certain logs, runs, and errors more easily.
Below we will go into details for each page.
Runs
A "Run" is when a Schedule is run (by the Scheduler) or when a Transfer or Group of transfers is run manually. Per default, it shows the last page of the latest runs (the system will automatically calculate a fromdate and use it as a filter to show only a reasonable amount of runs).
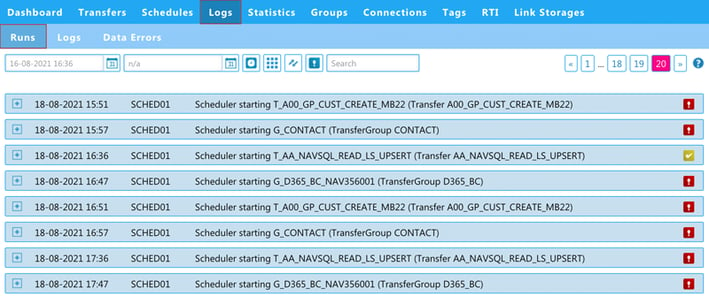
Image: Overview of 'Runs' now located under Logs > Runs
Line Details
Let's dive into the information available in each line. So, what does all this information in each line mean? You can hover over each piece of information for further information. However, below I will explain more about the details in each line.
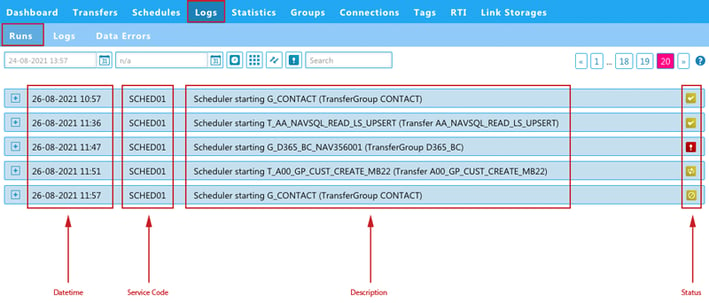
Image: 'Runs' - illustration of content in each line
In each line, as illustrated in the image above, you have information about:
- DateTime: The date and time of the Run
- Service Code: Indicates whether the Run was executed by the Scheduler or manually.
- Description: A description of the Run.
- Status: The icons to the far right indicate the status of the Run (ok, error or processing).
Clicking the [+] icon next to the DateTime will show you all the Log entries belonging to this Run as illustrated in the image below.
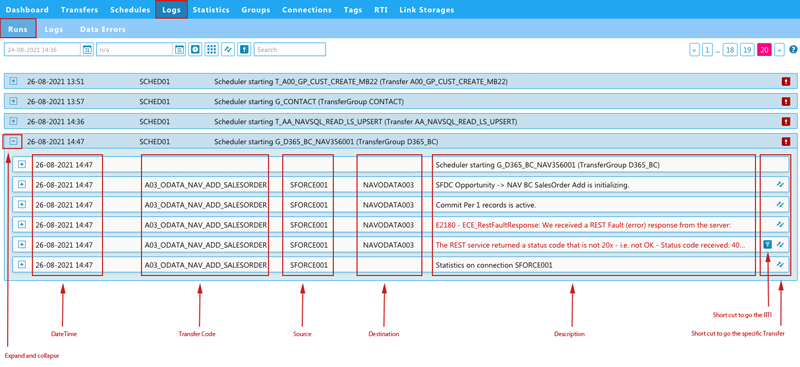
Image: 'Runs' - a run expanded showing the belonging Log entries
Please see below for a more detailed description of the Log entries.
Logs
Clicking the sub-page 'Logs' under 'Logs' will show you all the Log entries. Per default, it shows the last page of the latest log entries (the system will automatically calculate a fromdate and use it as a filter to show only a reasonable amount of log entries).
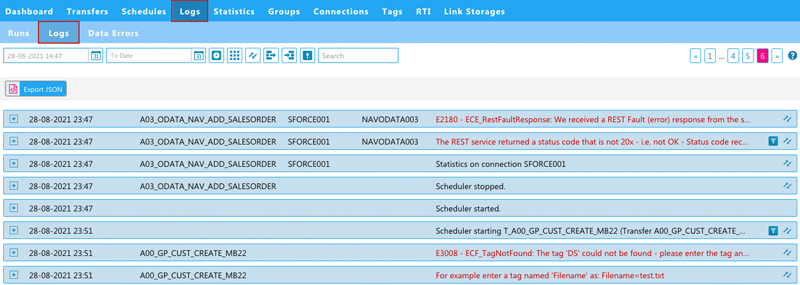
Image: 'Logs' page now located under Logs > Logs
Line Details
Let's also here dive into the information available in each line.
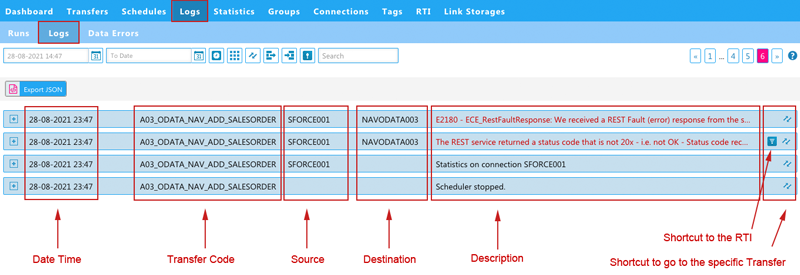
Image: 'Logs - illustration of content in each line
In each header of the log entry line, as illustrated in the image above, you have information about:
- 'DateTime': Date and time of the log entry
- 'Transfer Code': Code of the Transfer in question
- 'Source': The Source Connection
- 'Destination': The Destination Connection
- 'Description': Description of the Log entry. Error Log entries are marked in red.
To the right, we have a link to the specific Transfer and if the Transfer is using Source Control or Mirror then there is also a link to the specific RTI entry.
Log Entry details
Clicking the [+] icon next to the DateTime will show you the details of each Log entry as illustrated in the image below.
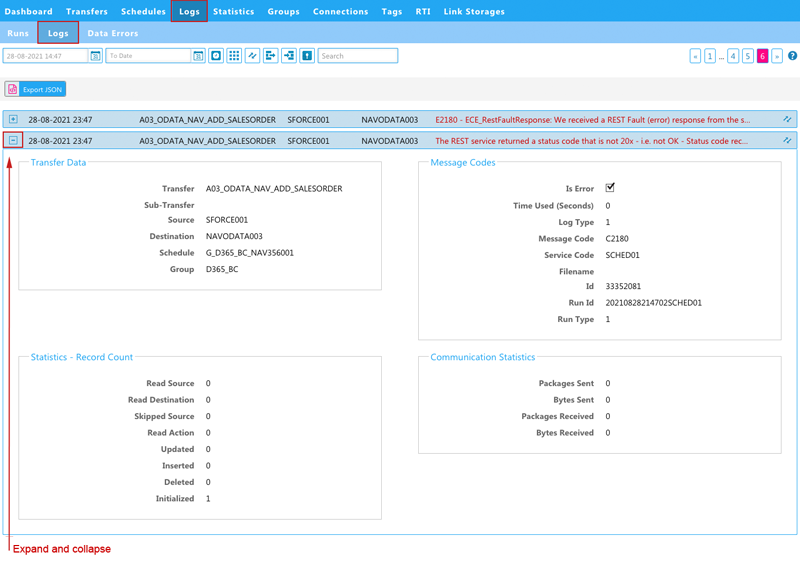
Image: Log entry details
Under the details, you can see more information about the log entry categorized in four different categories: Transfer Data, Message Codes, Statistics - Record Count, and Communication Statistics. Please see the wiki for more information: Log Entry Details
Data Errors
As the third sub-page under 'Logs', you will find the 'Data Errors' sub-page, which is a new page we have added in our new release.
This page shows the data errors generated when you have the 'continue on error' feature enabled under a Transfer. Read more about the 'Continue on Error' feature.
So not all errors will be visible here, only the errors related to the 'continue on error' functionality, other errors will be shown under Logs.
Per default, we have set a filter to show only the data errors that are "Not resolved". This is done to help you focus on the data errors that you still need to take care of.
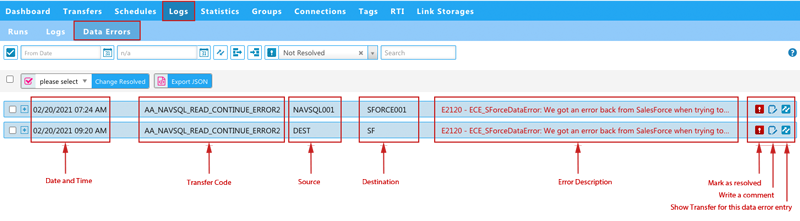
Image: 'Data Errors' subpage - overview and description of the content of each line
In each line, as illustrated in the image above, you have information about:
- 'DateTime': Date and time of the data error (when the Transfer was run)
- 'Transfer Code': Code of the Transfer that was run
- 'Source': The Source Connection
- 'Destination': The Destination Connection
- 'Error Description': Description of the actual error that occurred marked in red
To the right the first icon shows you if the data error is marked as resolved or not ('resolved' is indicated with a green checkmark and 'not resolved' is indicated with a red exclamation mark - as illustrated in the image below). You can click the icon to mark the data error as resolved/not resolved. You can also add or view a comment and go directly to the specific Transfer in question.
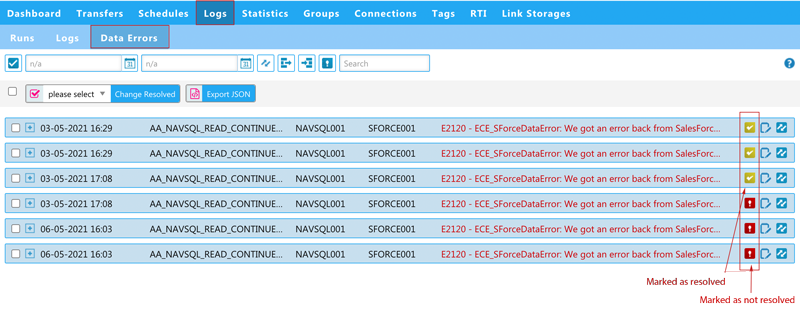
Image: 'Data Errors' subpage with both resolved and not resolved data error entries
Data Error Entry Details
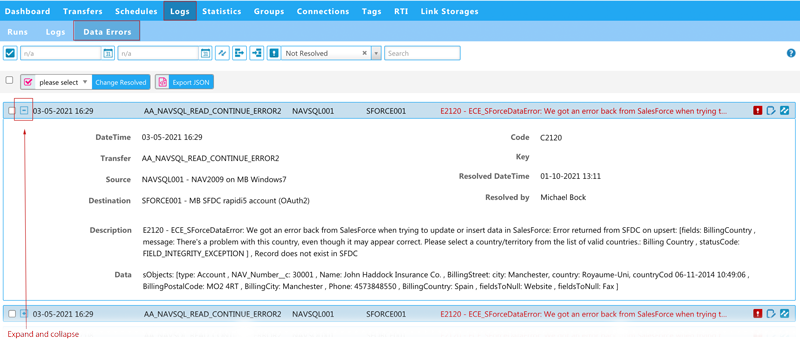
Image: 'Data Errors' entry expanded to see more details
You can always expand each line by clicking the [+] icon to see all the details about this particular entry. Please refer to the Data Errors description on the wiki for a more detailed explanation of each field.
Typical Workflow with 'Continue on Error'
With these types of data errors (arising when you have the 'continue on error' enabled on a Transfer) those errors need to be corrected (manually) by you as the user - typically in the source system.
- A Transfer with 'continue on error' enabled is run.
- If the log entry for the Transfer indicates that there are data errors, then detailed data errors will be written to the 'Data Errors' page (one entry for each record that failed to be written to the Destination system).
- You log in to MyRapidi and go to the 'Data Errors' page to see the details of each data error that you need to take care of.
- You correct the data in the Source system.
- You mark the corresponding data errors as resolved either by clicking the red icon to the right, directly in the list or selecting the error(s) and using the dropdown menu and mark it as resolved.
After you have corrected the error(s) in the source system, the data would normally automatically get transferred again (assuming you have a Schedule set to run automatically and for example if you are using Source Control).
Filter 'Resolved' or 'Not Resolved'
Under the Data Errors page, we have a filter option that lets you filter on 'only resolved' or 'not resolved' entries - as illustrated below.
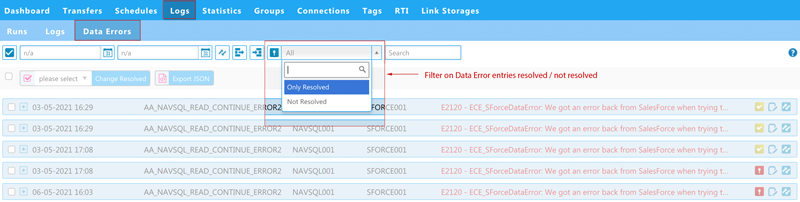
Image: 'Data Errors' filter resolved / not resolved
To learn more about filtering please refer to the wiki description on How to use Filtering and Search on MyRapidi
Resolved, Error, and Toggle
Also under the Data Errors page, you have the possibility to select specific entries and mark them as either resolved, error, or toggle between those options.
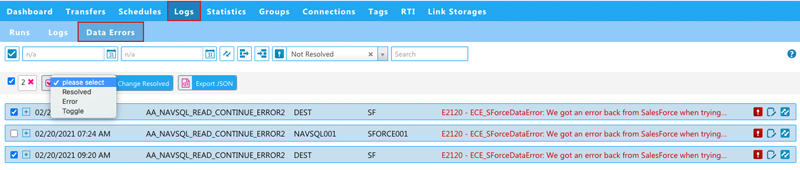
Image: 'Data Errors' subpage with select function in use
I think we covered a lot now and now it is time for you to view the pages and try out the new functionality. We hope you like the new Logs pages, as always feel free to contact us if you have any comments, feedback, or other wishes.
For the latest updates please read the updated blog post on Logs, Runs, and Data Errors please read Runs Page Explained