
Making the case for integration: how to calculate integration ROI and win executive approval
Most teams already know they need integration. What is hard is proving it to leadership in money. This article covers the hidden costs of disconnected systems, why integration business cases get stuck, and a five-lever framework for working out integration ROI and the payback period.
Short answer: to calculate integration ROI, convert manual work into money. Count the hours your team spends re-entering data, fixing errors and pulling reports, multiply by the fully loaded hourly cost, add the cost of duplicate orders and missed deals, then compare that annual figure with the cost of the integration. The Data Integration ROI Calculator does the arithmetic and returns the annual benefit, the ROI and the payback period.
In our recent webinar, Beate H. Thomsen and Zydra Tubelyte looked at what disconnected systems cost in practice, why the business case so often gets stuck, and how to turn integration benefits into a case leadership can approve.
What are the hidden costs of disconnected systems?
When your systems do not talk to each other, someone has to move the data between them by hand, every day, and that time never appears as a line in the budget.
Most businesses run on a mix of systems: a CRM for sales and service, an ERP for orders and finance, spreadsheets for reporting, a helpdesk for support, an HR system, and tools for projects, the warehouse or the web shop. When these are not connected, the same problems appear in every department.
- Sales: reps enter deals separately in the CRM and the ERP, so pipeline data drifts. About 3 hours a week per person.
- Customer service: agents switch between several tabs to answer one question. About 2 hours.
- Operations: order and inventory data fall out of sync, which causes shipping errors. About 4 hours.
- Finance: month end means exporting, cleaning and reconciling spreadsheets by hand. About 5 hours.
Those figures are illustrative and yours will differ, but the pattern repeats. Together they are 14 hours every week. Over 48 working weeks that is 672 hours a year, about four months of one person's time, and at a fully loaded rate of 100 euros an hour, roughly 67,000 euros.
The cost also goes beyond productivity. Gartner puts the cost of poor data quality at at least 12.9 million dollars a year for the average organisation, a figure from its 2020 survey of data quality reference customers. Most of it never appears on an invoice, which is exactly why it has to be estimated rather than ignored.
- Decisions: reports built on stale, conflicting data lead to slower and riskier calls.
- Customers: every extra minute spent finding an answer is a minute the customer feels.
- People: repetitive manual work quietly drives frustration and turnover.
- Revenue: deals are missed or delayed, and invoices go out late because the data was not ready.
Why does the integration business case get stuck?
Because the problem is described in operational terms, while leadership decides in financial terms.
In twenty years of these conversations the sentence we hear most is that everyone knows integration is needed, and the hard part is proving it. Leadership does not approve tools, it approves returns. A request that sounds technical is read as a technical problem, and technical problems wait.
The fix is to translate what employees say into what leadership needs to hear.
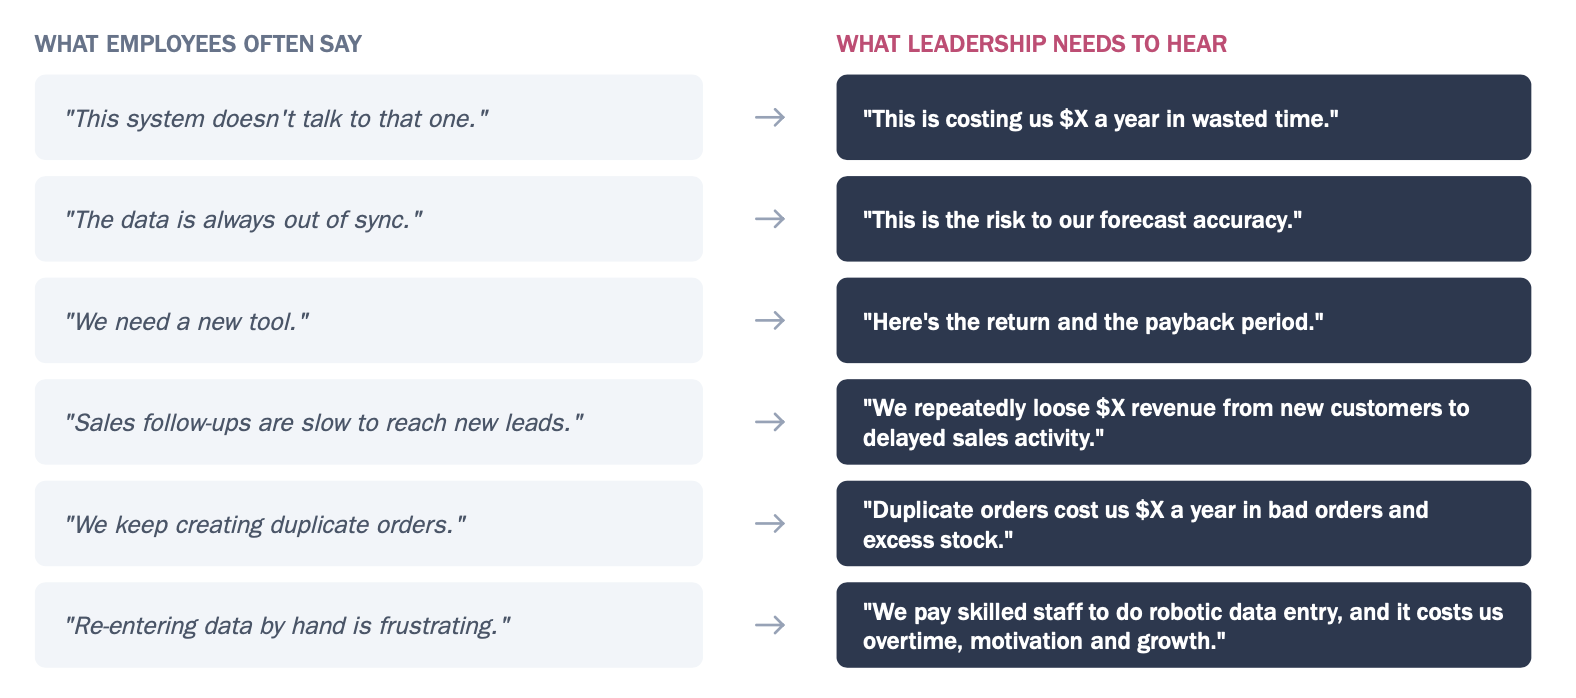
| What the team says | What leadership needs to hear |
|---|---|
| These systems do not talk to each other | This costs us a specific amount every year |
| The data is always out of sync | This is the risk to our forecast accuracy |
| We need a new tool | Here is the return and the payback period |
| We keep creating duplicate orders | Duplicate orders cost us X a year in bad orders and excess stock |
| Re-entering data by hand is frustrating | We pay skilled staff to do robotic data entry |
Four lessons from more than twenty years of integration business cases:
- Translate hours into money. Calculate savings at fully loaded cost, not the headline salary.
- Link to priorities. Connect the case to leadership goals such as growth or service level, not to the tool.
- Start small. Focus first on one painful process instead of mapping the whole roadmap.
- Show the cost of doing nothing. Put a number on staying manual, not only on the benefits of acting.
How do you calculate integration ROI?
Integration pays back through five levers: productivity savings, error reduction, faster decisions, employee experience and AI enablement.
1. Productivity savings
The hours automation saves.
Employees doing manual entry x average hours per week x fully loaded hourly cost x working weeks per year = annual cost of manual work
2. Error reduction
Fewer duplicates and costly mistakes.
(Duplicate orders x value lost) + (critical errors x cost per error) + (missed opportunities x deal value) = annual cost of mistakes
3. Faster decisions
Better visibility and reporting.
(Hours gathering information for a report x reports per week x employees involved) + (hours checking several systems for one answer x employees involved) = cost of manual reporting
4. Employee experience
The combined result of reducing friction across the first three levers: re-entering data, wrangling spreadsheets, collecting information from disconnected systems and fixing avoidable mistakes. It is reported in hours saved rather than money, so it never inflates the financial case.
5. AI enablement
Integration is the foundation for AI. Before investing in AI, ask a simpler question: how many of your core systems are actually connected, and how consistent is the data across them?
“AI is as good as your data is.”
Zydra Tubelyte, VP of Customer Success and Growth at Rapidi
Putting it into one formula
- Total annual benefit = labour savings + error reduction + faster decisions + revenue protection
- ROI percent = (total annual benefit - total annual integration cost) / total annual integration cost x 100
- Payback period = total integration investment / monthly benefit
What does this look like for one company?
In the webinar's illustrative example, a mid-sized company reaches an annual benefit of 180,000 dollars, a 240 percent return and a payback period of five months.
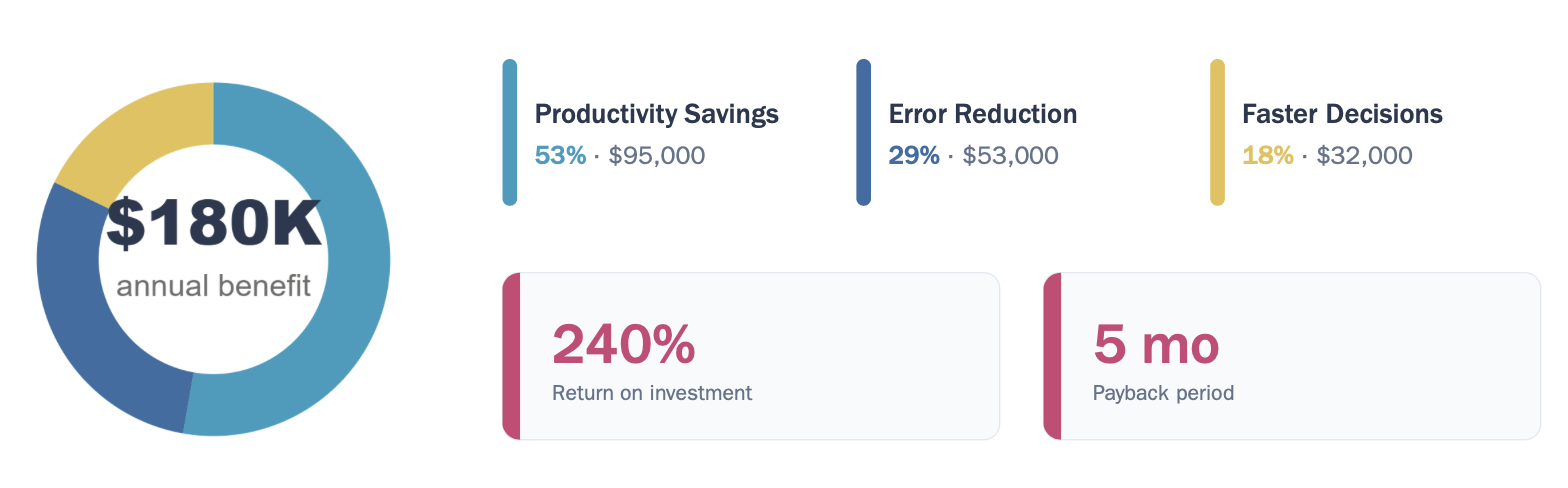
Productivity savings make up 53 percent of that benefit, error reduction 29 percent and faster decisions 18 percent. The exact numbers are not the point. What matters is how the categories add up, and that relatively small operational improvements become a substantial figure once they are counted across the business.
How do you bring the case to your leadership team?
Start with the cost of doing nothing, then show the return.
- The cost of disconnection: disconnected systems cost more than time. They also cost decisions, service and revenue.
- Quantify the pain: turn the pain into money before you talk to leadership.
- Build the case: use the five-lever framework so the case is complete and credible.
- Start strong: open the conversation with the cost of doing nothing.
In short: leadership does not approve tools, it approves returns.
How do you run your own numbers?
Use the free calculator. It covers all five levers and returns the annual benefit, the ROI and the payback period in one result.
The Data Integration ROI Calculator takes a few minutes, and nothing you type leaves your browser.
- Set the header: your currency, your working weeks (48 is typical, allowing four weeks of holiday) and the hours in a full-time week, for example 37.5.
- Set how much of the manual effort is recoverable through automation. The default is 80 percent, not 100, because an integration still needs monitoring.
- Fill in the three sections: the people and hours spent on manual work, the duplicate orders and critical errors, and the reporting time.
- Enter your expected Rapidi cost for year one, licence plus implementation.
- Read the annual benefit, the ROI and the payback period, then print the result or save it as a PDF for the board pack.
Rapidi is a no-code integration platform, and the company has been connecting business systems since 1987, so the implementation side of the equation is usually a matter of weeks rather than a development project. Pre-built templates cover the common pairs, including Salesforce with Microsoft Dynamics 365 Business Central, Dynamics 365 Finance, Dynamics NAV, Dynamics AX and Dynamics GP, and HubSpot with Business Central.
Frequently asked questions
What is the most common reason integration projects fail even after receiving budget approval?
Budget approval alone is not enough. Teams also need allocated time, resources and internal capacity. Someone has to own the decisions about how systems connect, which data moves between them and how the processes work. Without dedicated capacity and clear ownership, even a fully funded integration project stalls.
Are there specific industries where this integration approach is less effective?
No. The underlying challenge is the same everywhere: disconnected systems create manual work, duplicate entry and slow processes. What changes is which systems need connecting and where the impact lands. For one company that is CRM and ERP, for another it is the ERP and a warehouse management system.
What if our manual tasks are sporadic or seasonal rather than daily, is the ROI still substantial?
Yes. Calculate how much time those tasks take over a longer period, then compare that cost with the investment. Annual hours, labour cost and error correction are what decide it, not whether the work happens every day.
How do I secure buy-in from the finance department if they are resistant to changing their manual reporting?
Focus on measurable financial impact. Count the time finance spends on spreadsheets, reconciling, re-entering data, correcting errors and preparing reports by hand, then convert those hours into labour cost. That is the number that moves a finance team, and the calculator produces it.
How do we quantify employee experience and decision speed for a CFO who only cares about direct cost reduction?
Translate both into time, then into money. Count the hours spent searching for information, transferring data by hand, reconciling discrepancies and fixing errors caused by disconnected systems, and convert them at the fully loaded cost of an employee. It also answers a question finance already asks, because the annual waste is the argument when extra headcount is hard to approve.
How do we account for the total cost of ownership when calculating the payback period?
Use the total cost for year one, licence plus implementation, as the investment figure. That is what the calculator asks for, and it is what makes the payback period defensible in front of a board.
Take the next step
Run your own figures in a few minutes, then bring them to a call with us. Thirty minutes, no obligation, no cost.