
Runs Page Explained
Since then we have been working on improving the use of Logs data even more, in particular, we have done improvements to the Runs page.
Workover of The RUNS Page
The aim of the workover is to improve your possibility to get a quick overview of the Runs. We have added some more useful information about each Run that should help find the information you need.
Just to recall how we define a "Run", a "Run" is when a Schedule is run (by the Scheduler) or when a Transfer or Group of transfers is run manually. Per default, it shows the last page of the latest runs (the system will automatically calculate a 'fromdate' and use it as filter to show only a reasonable amount of runs).
Please note: When clicking the + icon to see the log entries, we now redirect immediately to Logs if there are many log entries for this Run.
We have optimized the SQL queries as much as possible to work as fast as possible and to show a reasonable number of runs.
Overview
The image below illustrates the overview page. In each header line you will have information about:
- Date and time: indicating the date and time of the run
- S or M icon: indicating whether the Run was scheduled (S) or run manually (M)
- Source Connection(s)
- Destination Connection(s)
- Description
- Duration of the Runs (in total)
- Number of Log Entries for this Run
- Log icon: Shortcut to go to the Log Entries of this Run
- Status: Status icon indicating whether the Run has run through ok, still processing or that there is an error
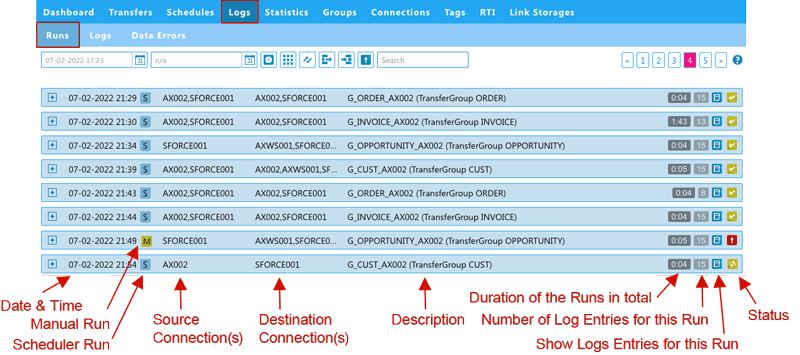
Manual Run, Scheduler Run

Manual Run expanded
A manual run could for example be if you click 'activate changes' or 'read design'. Below you see an example of a manual run and its details to it.

Scheduler Run expanded
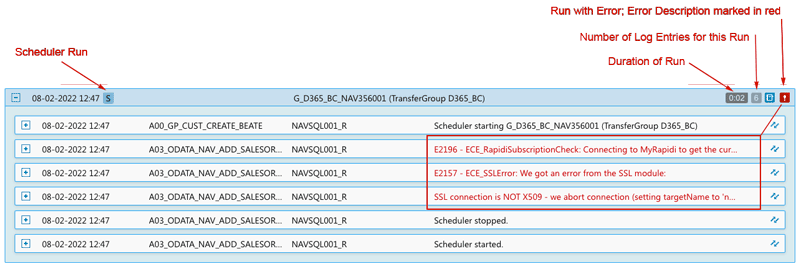
Clicking the [+] icon next to the Date and Time will show you all the Log entries belonging to this Run as illustrated in the image below.
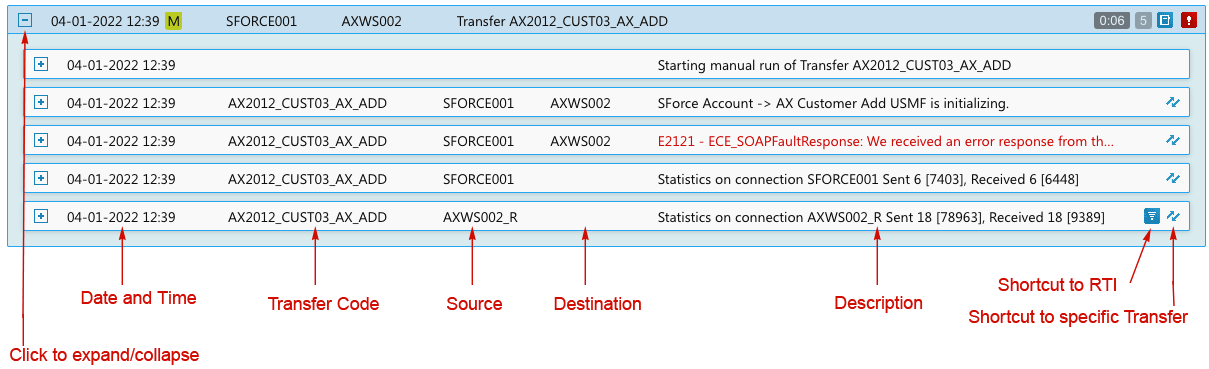
image: more details about the Run showing the belonging Log Entries
In each header of the log entry line, as illustrated in the image above, you have information about:
- 'DateTime': Date and time of the Log Entry
- 'Transfer Code': Code of the Transfer in question
- 'Source': The Source Connection
- 'Destination': The Destination Connection
- 'Description': Description of the Log entry. Error Log entries are marked in red. Hovering over the Description will should the entire description or error message.
To the right, we have a link to the specific Transfer and if the Transfer is using Source Control or Mirror then there is also a link to the specific RTI entry.
We hope you like the new Runs page and please don't hesitate to reach out to us if you have any questions and comments.
Head over to our latest webinar recording to learn more about the Runs: VIDEO: MyRapidi Product Update Webinar February 2022